Using the Tools in Your Performance Excellence Toolbox: Part 19 Benchmarking Preparation

Using the Tools in Your Performance Excellence Toolbox: Part 19 Benchmarking Preparation

This is the ninetieth in a series of posts on using performance excellence tools. Benchmarking is a tool that can really help you determine the best solution to your problem.  This post will begin to cover the preparation for the benchmarking exercise.

You have enlisted your benchmarking partner(s)[1].  As difficult as that might have been, you now need to start to prepare for the benchmarking itself the preparation is even harder.

Preparation is critical.  A benchmarking exercise is not a bull session.  You need to research, document and rehearse your objectives for the meeting.

The key is successful time management.  You are not shooting the breeze with your benchmarking partner.  They have graciously given up some of their valuable time to work with you, regardless if you are sharing information with them or not, it is an imposition on them.  You cannot waste their time.  You can waste your time all you want as long as your management will tolerate it, which I hope is not at all.

In identifying your benchmarking partner, you have done some research into their process otherwise why would you have selected them?  Oops, you did not research their process!  Now you have to do it.  Suppose you find that they are not the best/better practice, what now?  Do you have to back out?  Yes, you do and the politics of that is all on you.

So rule one, do most of your research as part of the step in identifying best practices.  You have identified the problem that you need to benchmark and hopefully established your CTQ’s.

Suppose you are running your local Meals on Wheels.  You need to improve your delivery system.   Who has the best of breed in delivery?  You find businesses that do delivery as a core business function.  USPS, FedEx, UPS for example.

But you are a small outfit how can you get them to work with you?  Two approaches.  First, the big guys work out of local facilities.  Go after them at the local level.  Second, there are successful local delivery services that may help.  They have to be doing something right in order to compete with the big guys.

They agree to meet with you.  What are you going to ask them?  We’ll discuss this in the next post.


[1] Your process may cross several functions.  You want to benchmark the best in each of the functions.  To get the most out of the benchmarking exercise, you may want to or need to benchmark more than one organization or process to gain the information needed.

For example, consider you are revamping your entire back office functions, human resources, accounts payable, accounts receivable, procurement, etc.  You need to identify the best practitioners for each of these areas.
 

Using the Tools in Your Performance Excellence Toolbox: Part 18 Benchmarking Understanding Your Process

Using the Tools in Your Performance Excellence Toolbox: Part 18 Benchmarking Understanding Your Process

This is the eighteenth in a series of posts on using performance excellence tools.  Benchmarking is a tool that can really help you determine the best solution to your problem. However, to do it you need to know what to be benchmark.

Before you can benchmark your process, you need to understand it.  If you have been using a DMAIC, DFSS, Lean or some similar process, you should have identified where your needs are through the Measure and Analyze stages.  Your CTQs should identify for you what are the priority areas to benchmark.  It is not necessary to benchmark everything in the process only those critical to quality.

If you have not analyzed your process stop!

You must analyze it before going any further.  You need to know where the problems are.  They need to be measurable.  This is critical later on when selecting a benchmarking partner and when actually benchmarking.

As stated above use the tools in the Measure and Analyze stages particularly those that identify what is Critical to Quality, e.g. CTQ Tree, flowchart, value stream mapping, fishbone diagram, cause and effect diagram, SWOT analysis, etc.

Using the Tools in Your Performance Excellence Toolbox: Part 14 Affinity Diagrams, Making Sense of Brainstorming Results

Using the Tools in Your Performance Excellence Toolbox: Part 14 Affinity Diagrams, Making Sense of Brainstorming Results

This is the fourteenth in a series of posts on using performance excellence tools. Brainstorming potential solutions is an excellent jumping off point for improving your process/fixing the problem.

When brainstorming, remember that you must avoid the all too familiar approach of “here’s your solution now what’s your problem.”  Preconceived solutions are not necessarily to be ruled out completely or out of hand.  Some of them can be identified as you work through the earlier steps of the process.  In fact using a parking lot for these ideas as you work through the Define, Measure and Analyze stages is an excellent way of holding on to these ideas.  In other words don’t trust your memory, capture it at the time.

A parking lot is used when a thought, idea, notion, etc. comes up that is not appropriate for the current efforts but might be worth considering at another time.  Simply, capture the idea on a flip chart, in a spread sheet, in your meeting minutes, whatever works for you.

Brainstorming gets you a quantity of ideas on the table quickly.  It is the sorting out of those that have real potential vs. the others that have limited or no potential.

One method of sorting the brainstorming results is an Affinity Diagram.  This method allows you to take dozens or even one hundred or more distinct ides and consolidate them down to a few categories to work from in an amazingly short amount of time.

  1. Start by capturing each idea on a separate sticky note. (don’t forget those in the      parking lot)
  2. Randomly place the sticky notes on a wall.
  3. Have the team go up to the wall and sort the notes into groups.
    1. Note groupings (affinities) grow organically and are not set up in advance.
    2. They need to do this independently.
    3. The best results are when they do it in silence.
  4. One team member can move a note from the group that another had placed it in.  This is done until all the notes are in groups.  It is alright to have a few outliers that just don’t fit naturally into any of the groups – don’t force fit them.  Also don’t forget      about them or dismiss them, they may have the answer – the lone voice crying in the wilderness.
  5. After a while  (10 minutes to 30 minutes generally) the notes are grouped.

You should wind up with anywhere from two or three groups up to maybe eight.  If you have more than eightish groups, you may want to go back to the sorting and see if you can consolidate the groups.   Also if there are groups that could be merged into a broader affinity try to do that.

As a team look at the resulting groups and determine which ones have the most value/potential for leading to an improvement or fix to the process.

Affinity Diagrams are also a good tool to use to help sort out the results of focus groupsVOC feedback, distilling them into a CTQ Tree.

I use MindManager MindJet product occasionally to produce an Affinity Diagram.  This is especially useful when you have a project team with limited time available or who lack basic Lean Six Sigma training.  I gather the input from the brainstorming exercise and create the Affinity Diagram by myself.  This also works great if you are working on your own and want to organize your thoughts quickly.


Using the Tools in Your Performance Excellence Toolbox: Part 10 Cross Functional Tools

Using the Tools in Your Performance Excellence Toolbox: Part 10 Cross Functional Tools

 This is the tenth in a series of posts on using performance excellence tools.  It covers how most of the tools already discussed can be used in different functions and stages of performance improvement.

Novices and purest can make a mistake when selecting and applying tools.  They think that a tool is specific to a discipline approach such as Six Sigma, Lean, PMBOK, etc. or a stage of that discipline and can only be used in that discipline or stage.  Or worse that every tool identified for a stage must be used.  Neither is correct.  The best tools to use in any stage are the tools that meet the requirements — that get the job done.  This includes tools not normally associated with performance improvement.

These tools can be used the same way whether you are doing the first three stages of Lean Six Sigma, Six Sigma DMAIC or Design for Six Sigma DMADV.  In all of these you need to Define, Measure, and Analyze.

The table below lays out the tools and what stages they are generally used in.  The dark shaded cells indicate that the tool is a primary one for that stage.  The light shaded cells indicate that it should be referenced in the stage.  This is especially true for the Charter, Gantt Chart, and CTQ.

Cross Functional Tool Matrix

Using the Tools in Your Performance Excellence Toolbox: Part 3 Tools to Find Out What the Customer Wants

This is the third in a series of posts on using specific tools. It covers two basic tools designed to help you determine what your customer’s real requirements are. When I started my quality journey some three decades ago, we were taught the four pillars of TQM were Error Free Work, Measure by the Cost of Quality, On Time Delivery, and Meet the Requirements.

Customers?

Requirements?

Who are customers and why should I care about what they require?

A customer is more than the person who buys your product or service. Anyone who you interact with can be a customer or a supplier. For example; as the executive director of your organization, you prepare an annual report for the board of directors. You are the supplier and the board members are the customers.
Requirements are “… a singular documented physical and functional need that a particular product or process must be able to perform…It is a statement that identifies a necessary attribute, capability, characteristic, or quality of a system for it to have value and utility to a customer, organisation, internal user, or other stakeholder.” (Requirement, 2013)
There are two basic tools to use for determining the customers’ requirements, Voice of the Customer (VOC) and Critical to Quality (CTQ). In addition there is a highly complex tool – the House of Quality (HOQ).

VOC is just what it sounds like; you are getting direct input from your customers. This means you are listening to them and not using anecdotal or second hand information, SWAGs, or your own ideas to identify the project’s requirements.

There are three basic ways to gather VOC.

• Surveys are a popular way to attempt to gather information. Their main value is when used to gather a lot of responses to a few questions. The biggest short coming of a survey is the limiting factors and variables that impact the response rate and value of the responses. In simple terms value is the inverse of the response rate. The more questions you ask on a survey, the fewer responses you get.

Surveys also lack any interactivity between the surveyor and respondents.

• One-on-one interviews gather a good deal of information from one person. They provide interactivity between the interviewer and interviewee. Threads exploring relationships between ideas can be developed.

Conducting one-on-one interviews require a lot of resources to conduct the interview.

• Focus groups are probably the best means to gather VOC. You have a group of employees (stakeholders) that you tap for their thoughts, ideas, experiences, etc. What makes focus groups the most value added format is that they allow interchange of ideas. They stimulate ideas among the participants. This is an example of the whole being larger than the sum of the parts.

To conduct a focus group, you need to have a skilled facilitator. I suggest that the focus group be no larger than 10 people with 7 or 8 being the best number. You should have at least two facilitators. It is very helpful to record the topics explored on a flip chart, whiteboard, etc. so that participants can follow along and refer back to previous topics.

One of the facilitators will serve as the scribe. If you don’t have a scribe, you need to take the notes yourself. This is not a good approach since you are splitting your focus.

Now that you have gathered the VOC, you need to translate VOC to Critical to Quality. This will enable you to determine what it will take to deliver the customers’ requirements.

Determining what is critical to quality provides you with:
 What your customers measure your product or services by
 Links to customer needs from VOC drivers and specific measurable characteristics
 Processes to transform general data to specific data
 Measurable results

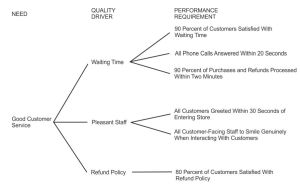
You do it by using a CTQ Tree. The tree consists of three steps, Need, Drivers, and CTQs. An often used example is the need to improve customer service (figure 1).
CTQ tree
© Mind Tools Ltd, 1996-2013.
Figure 1 CTQ Tree for improving customer service
You are dealing with needs not wants. Looking at the example:
• The Need is good customer service. This is a general need not a specific need. Throughout the process you are driving from generalities to specifics. They move from being hard to measure (need) to measurable results (CTQs).
• To establish the Drivers ask “what would that mean” or “what would that look like.” You do this until it is not worth drilling down any further.
• When you have drilled down far enough, these are your CTQs.
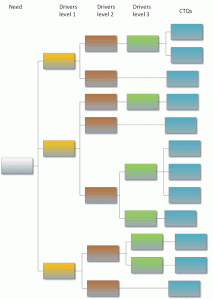
To give you a better idea of how the drivers can be multi-level see figure 2.

ctq multy driver
Figure 2 Multi-level drivers CTQ Tree
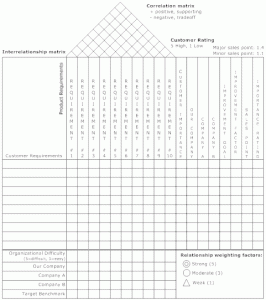
Figure 3 is an example of a basic House of Quality template. This tool requires a good deal of experience to use it properly. This can include benchmarking comparisons with other companies to help understand your position along with several other aspects to assist decision making.
HOQ
Figure 3 House of Quality