Using the Tools in Your Performance Excellence Toolbox: Part 16 Developing Your Plans
This is the sixteenth in a series of posts on using performance excellence tools. You have narrowed your potential solution to hopefully one or at most three. Your next step is to develop the plans required to test your potential solutions.
First did you answer the questions in my post – Using the Tools in Your Performance Excellence Toolbox: Part 15 Selecting Your Potential Solution – satisfactorily for each of the potential solutions?
- Do you have the required resources to implement the solution?
- Does it fit your business culture?
- Do you have the political backing needed to implement
If you read the standard works on Lean and Six Sigma on planning your solutions for testing, you will note that it is extremely heavily tilted to manufacturing particularly statistical analysis of the workflow.
For example control charts are generally set up to measure large amounts of data points, e.g. manufacturing 100 widgets an hour over 10 shifts a week or processing thousands insurance claims.
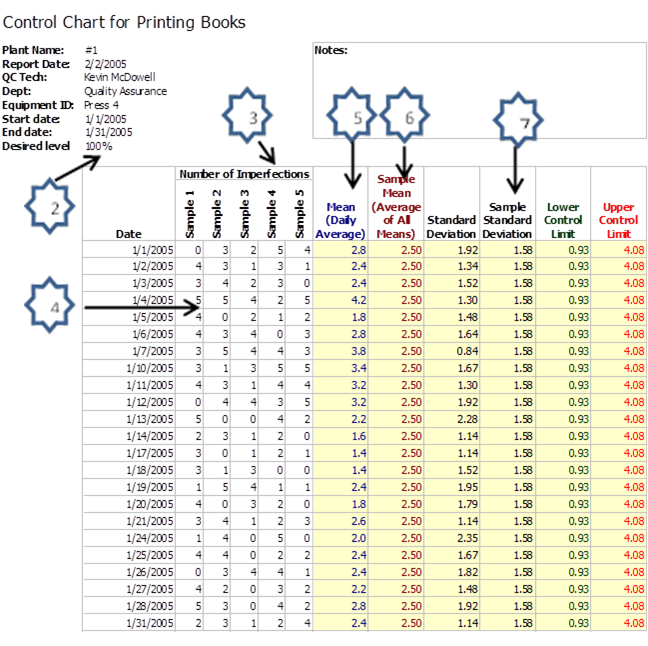
To use a control chart for low volume transactions requires some tweaking of design to help you track the performance of the process. You have baseline data from your earlier stages post to start the measurement process. Here is an example of a simple control chart using a MS Excel template.
Using a control chart
- Determine what a defect (imperfection) is. A sample can have several defects. In this example a defect could be:
- Smudges
- Misaligned page
- Incomplete print/missing letters
2. Determine how big a sample size you are going to use. Do you want to do a 100% sampling or a representative sampling? The more you sample, the more accurate your results will be. But the more it will cost you to do the research.
3. Determine the frequency of sampling. How often you do you want to sample.
- Example for points 2 and 3. You want to sample one item in 10 on each line. Or one item in 10 on every third line.
4. Record the number of defects per sample.
5. The chart automatically calculates the mean (average) for all the samples in the daily sample period.
6. It then calculates the mean for all the daily means.
7. The next four steps calculate the various deviations from the norm.
Many of the tools you can use during the planning step have already been discussed in previous posts. These include:
- Project Charter
- Gantt Chart
- Pareto Chart
- PDCA Cycle
Review your project charter.
If you did not create a Gantt Chart earlier, you need to do so now. If you have one, it is time to update it to reflect the improvement plans steps.
